By Jeff Saut, Chief Investment Strategist RJF, Monday 27 August 2018
We’re an all time high,
We’ll change all that’s gone before.
Doing so much more than falling in love.
On an all time high,
We’ll take on the world and wait.
So hold on tight, let the flight begin.
. . . Rita Coolidge, the movie “All Time High,” James Bond
So, we are finally back after a week in Boston, a week in New York, and a week in San Francisco. Our missions were to see portfolio managers and do some gigs for our financial advisors (FAs) and their clients; mission accomplished! As we were doing that, we repeatedly were questioned about the length of this secular bull market. Said questions were amplified by the story in last Thursday’s Wall Street Journal titled, “Sorry for Quibble, but This Record Is Bull.” In that article the author, and uber-smart James Mackintosh, notes:
The widely accepted definition of a bear market is a drop of 20% from the last peak in the cycle, while bull markets are usually measured from the lowest point reached until the peak before the next bear market. On that basis, the broad U.S. market has only been in a bull phase since October 2011, when most stock gauges were back in a bear market, down 20% from their post-crisis highs hit earlier that year.
In past missives we have argued that a 20%+ decline does NOT stop a secular bull market. In fact, Andrew Adams and I think the idea that a 20%+ rally and/or decline represents a bull or bear market is absurd. To repeat ad nauseam, the 1949-1966 secular bull market had numerous 20% pullbacks, but it did not stop that secular bull market. Similarly, the 1982-2000 secular bull market experienced the 1987 crash (we were actually in Barron’s in September 1987 calling for a “waterfall decline”), but it did not stop the bull market. I think it was Smith Barney’s crack technical analyst, Alan Shaw, that actually came up with the 20% mantra. While that may apply to “tactical” (short-term) bull and bear markets, it does not apply to secular bull markets.
Speaking to this secular bull market, we can make cogent arguments this “secular bull” could have begun from three different starting points. As often stated, the majority of stocks made their lows on October 10, 2008 when 92.6% of all stocks traded recorded new annual lows. However, the vast majority of folks believe the start began in March 2009, which was the nominal price low, or the lowest the actual index prices would get. That said, NOBODY measures the 1982-2000 secular bull market from the nominal price low of December 1974. Rather, they measure it from when the indices bettered their previous all-time high in August 1982. Using that metric suggests this secular bull market began in April 2013 when the S&P 500 (SPX/2874.69) bettered its previous all-time high. You can pick your starting point, but consider that secular bull markets tend to last 14+ years. So, if your starting point is October 2008, this one should last at least into 2022. If you like March 2009, the run should extend into 2023. Yet, if you use 2013 this thing could last until 2027. As stated, you pick it!
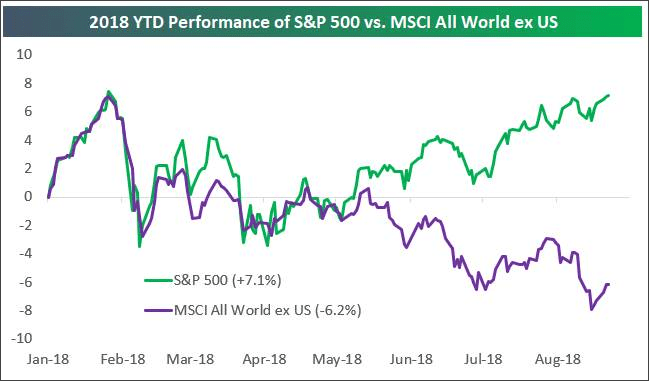
Over the past three weeks of travel, there have been some recurring questions, mainly from portfolio managers. To wit, “Jeff, the S&P 500 is up some 7% year-to-date, while the MSCI All World Index (ex U.S. equities) is down roughly 6%. Shouldn’t we reduce our U.S. holdings and move that money into international equities?” Clearly that’s a valid question, but history says no. As our friends at the invaluable Bespoke Investment Group write:
[Chart 1, page 3] shows the year-to-date performance of the S&P 500 vs. the MSCI All World ex US index (basically an index of international stocks). While U.S. and international equities performed right inline with each other through early May, their paths have completely diverged over the last three and a half months. As shown, at the moment, the S&P 500 is up 7.1% year-to-date vs. a decline of 6.2% for the rest of the world. Given the relative strength of U.S. stocks this year, investors may be tempted to fade the trade and start rotating out of the US and into the MSCI All World ex US index. History has shown, though, that this would not be a smart trade. In years when the US has outperformed, it has continued to outperform for the remainder of the year. In years when the US has underperformed, it has continued to underperform. While the trend of US outperformance will eventually turn, it’s best to ride it out through year end at this point at least based on historical tendencies.
Another ubiquitous question we got was about emerging markets (EM). Here is the “rub” with EM, as expressed by Jacob L. Shapiro, a geopolitical analyst for Geopolitical Futures:
The problem may now be coming to a head. Dollar-denominated debt has ballooned. In its latest quarterly report, the Bank of International Settlements found that U.S. denominated debt to non-bank borrowers reached $11.5 trillion in March 2018 – the highest recorded total in the 55 years the bank has been tracking it. Meanwhile, the dollar has strengthened amid a tepid global recovery from the 2008 financial crisis. As the currencies of indebted countries weaken against the dollar, it is becoming harder for some countries to pay their debts. This could be a bubble waiting to pop, especially if vulnerable countries don’t have the monetary policy options to protect themselves.
What these countries have in common is that they are all on a 13-country list released by the Bank of International Settlements. Together, they constitute 62 percent of all dollar-denominated debt held by emerging market economies. Turkey was one of the most vulnerable on the list, but there are four other countries facing similar challenges: Argentina, Mexico, Chile and Indonesia. Argentina’s peso is already in free fall. The government announced on Tuesday that it would sell $500 million worth of reserves and raise interest rates to stop the peso’s fall.
After meeting with a number of EM portfolio managers over the past few weeks, we think, if your time horizon is three to five years, EM, if bought when under pressure, should be fine.
The call for this week: Our models “said” to raise some cash in January and recommit that cash at the February 9 undercut low (the low below the “selling climax” low of February 6). Since then, we have been calling for new all-time highs. So it is said, so it is written, and so it is done. Again, as Leon Tuey wrote last Tuesday:
On Monday, all Advance-Decline Lines closed at record highs and the following also closed at record highs: S&P Mid-Cap, S&P Small-Cap, Value Line Arithmetic Index, Wilshire 5000 Composite Index, and SPDR S&P Retail ETF (XRT). Earlier this year, many talking heads felt that the market had seen its high for the year and some even declared that a bear market had commenced. Bear market? What bear market? Given their lousy track record, one wonders how they even have a job. Thankfully, they are not in the medical profession. As mentioned before, if these talking heads expend some effort trying to understand the market’s logic, instead of flapping their gums incessantly, they would improve their performance. Ignorance is bliss, I suppose. What about the Dow Jones Industrial Average and the S&P? Rest assured, they, too, will reach record highs.
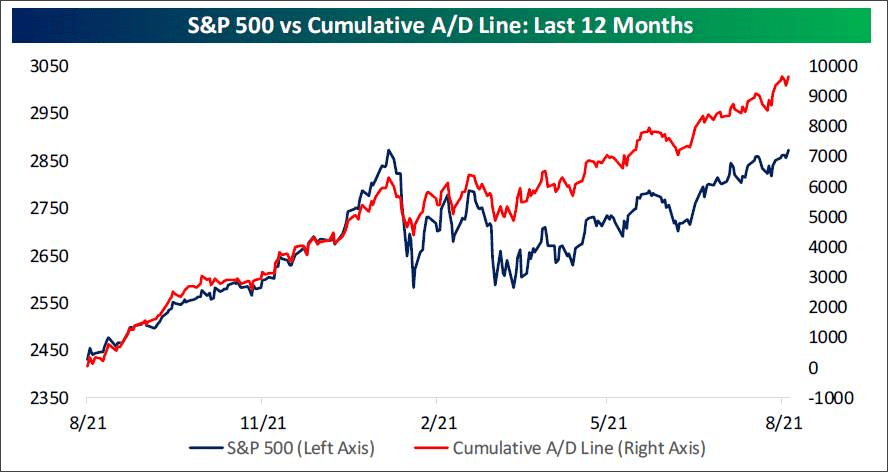
To Leon’s point, the Advance-Decline Line made new all-time highs last week (Chart 2, page 3), and every sector is participating as demonstrated by the fact that every sectors’ cumulative A/D line also tagged new 52-week highs. And in a stunning political turn, Senator Grassley, who oversees the DoJ, and his second in command, Senator Lindsey Graham, told President Trump he can replace Jeff Sessions with another Attorney General. Of course that probably means the end of Mueller and Rosenstein since Grassley and Graham have been ardent supporters of Sessions. Moreover, our contacts on Capitol Hill tell us that if Mueller does not make his case before Labor Day, he can’t do anything until after the mid-term elections for fear of influencing those elections.
Chart 2
Source: Bespoke Investment Group
Additional information is available on request. This document may not be reprinted without permission.
Raymond James & Associates may make a market in stocks mentioned in this report and may have managed/co-managed a public/follow-on offering of these shares or otherwise provided investment banking services to companies mentioned in this report in the past three years.
RJ&A or its officers, employees, or affiliates may 1) currently own shares, options, rights or warrants and/or 2) execute transactions in the securities mentioned in this report that may or may not be consistent with this report’s conclusions.
The opinions offered by Mr. Saut should be considered a part of your overall decision-making process. For more information about this report – to discuss how this outlook may affect your personal situation and/or to learn how this insight may be incorporated into your investment strategy – please contact your Raymond James Financial Advisor.
All expressions of opinion reflect the judgment of the Equity Research Department of Raymond James & Associates at this time and are subject to change. Information has been obtained from sources considered reliable, but we do not guarantee that the material presented is accurate or that it provides a complete description of the securities, markets or developments mentioned. Other Raymond James departments may have information that is not available to the Equity Research Department about companies mentioned. We may, from time to time, have a position in the securities mentioned and may execute transactions that may not be consistent with this presentation’s conclusions. We may perform investment banking or other services for, or solicit investment banking business from, any company mentioned. Investments mentioned are subject to availability and market conditions. All yields represent past performance and may not be indicative of future results. Raymond James & Associates, Raymond James Financial Services and Raymond James Ltd. are wholly-owned subsidiaries of Raymond James Financial.
International securities involve additional risks such as currency fluctuations, differing financial accounting standards, and possible political and economic instability. These risks are greater in emerging markets.
Investors should consider the investment objectives, risks, and charges and expenses of mutual funds carefully before investing. The prospectus contains this and other information about mutual funds. The prospectus is available from your financial advisor and should be read carefully before investing.
Black MondayOn 19 October 1987, the stock markets experienced a dramatic plunge that prompted many firms to shut down their trading desks and turn off their phones to minimize internal losses. Raymond James refused to do the same. Our desks stayed open to help meet clients’ needs, resulting in our first and only unprofitable quarter since the firm went public in 1983. |
 |
Who was Raymond James?The Raymond in our name is actually from Edward Raymond, owner of a 15-employee mutual fund sales group, Raymond and Associates, along Florida’s west coast. He sold his company to Bob James on 15 July 1964, on condition that the surviving firm be called Raymond, James & Associates. Three days after the sale, Ed Raymond was involved in a near-fatal automobile accident and never joined the firm. Nonetheless, even after Raymond had passed away, Bob James insisted that his name remain on the door – ahead of James’ own. That was a promise he made to Ed Raymond three days before the accident, and Bob James was a man who kept his promises. |

|
Bear Market of 1974The severe bear market of 1974 threatened the existence of Raymond James, which was bleeding capital by the day. Tom James, his father and other leaders took extreme measures to keep the firm afloat, slashing costs, foregoing paychecks and even attempting to sell the firm for just enough capital to protect client assets and retain as many associates as possible. The story could have ended very differently if not for a sharp upturn and continued rebound in the stock markets late in the year. |

|
Taking Raymond James PublicWhen consideration was being given to taking Raymond James public, Tom James penned a letter to shareholders (largely employees at the time). ” … the public offering should be considered as a statement of our independence. While this is a psychological rather than an economic rationale, it is nonetheless very important. We have asserted for some time that we are not interested in becoming a small part of a very large corporation. That assertion results mainly from the inclinations of management rather than the economic benefits associated with either alternative. The public stock offering affords us the opportunity to enjoy a little bit of the best of both worlds. While shareholders will be given liquidity at fair market value, we will still have the ability to control our own destiny.” After 40+ years of Tom’s leadership, upon becoming CEO, Paul Reilly was often questioned about whether the company might ultimately surrender its cherished independence and be acquired by some larger entity. His response: “Not while I’m around.” It’s a theme that continues today. |
 |