By Jeff Saut, Chief Investment Strategist RJF, Monday 3 December 2018
“Living with a loss is folly, taking a loss is wisdom.”
. . . Lewis Owen
For years we have quoted Benjamin Graham’s book The Intelligent Investor, which Warren Buffet has said is the best book ever written on investing. The operative quote from said book is “The essence of portfolio management is the management of risks, not the management of returns.” He closes that thought by saying, “All good portfolio management begins, and ends, with this premise.” My father put it much more succinctly when he said, “If you manage the downside in a portfolio, and avoid the big loss, the upside takes care of itself!” This is why investors need a good financial advisor, or portfolio manager, to manage the risk, re-balance portfolios, trim investment positions from time to time, hedge the downside at times, raise cash when appropriate, and hold investors’ hands through a bottoming process like we identified between October 2008 and March 2, 2009. At the time investors had not headed our “sell signals,” or managed the risk, given the Dow Theory “sell signal” of 11/21/07, or for that matter the Dow Theory sell signal of 9/23/1999 (we wrote about both of those). In fact, they were liquidating their equity holdings when they should have been buying. If they had managed the risks in either September 1999, or November 2007, their investment results would have been much better. We wrote about both of those “sell signals,” as well as the “buy signals” in June 2003 and March 2009. Now Wall Street’s “pretzel logic” has it that NOBODY can consistently time the stock market; and, we agree. However, if one listens to the message of the market, one can certainly determine if one should be playing hard, or not playing so hard. Verily, we think that cash is actually an asset class, which is why we are never fully invested. My father used to tell me, “To assume that the investment opportunity sets that are available you today, are as good as those that will present themselves next week, next month, or next quarter, is naive; and, you have to have cash to take advantage of those opportunities.” Accordingly, we always have a cash reserve.
We revisit these aforementioned thoughts as we enter tax loss selling season and reflect on the old stock market axiom from Lewis Owen, “Living with a loss is folly, taking a loss is wisdom.” Over the years, we have learned the hard way that when, and what, to sell tends to separate successful investors from the amateurs and drives much of a successful investment model. This is particularly true for 2018’s tax-loss selling season given the recent volatility and resulting mispriced “prices of paper” (read: certain stocks).
The causa proxima for the volatility, since our short-term sell signal of October 2, 2018, has been evolutionary. It began with the Mueller investigation’s revelations, the Chinese trade tiff, softening economic numbers, FED fright, heightened investors’ fears (near record bearishness), worries about peak earnings (we have heard this for the past six quarters), and the list goes on. Consistent with this, we advise participants to carefully review their portfolios, with an eye for selling companies’ shares whose fundamentals have deteriorated with little chance of improving in the intermediate to longer-term. We also like the strategy of “pruning” some shares from portfolios where “the news cannot get any better.” Remember, gains can be offset with losses for tax purposes, and that the rebalancing of asset classes may be in order. In this investment review process, some participants will not do their homework as well as others and therefore sell for tax reasons perfectly good companies where the bad news is already priced in and the fundamentals are bottoming. This spells opportunities for astute investors and is exactly the kind of environment where one is able to find mispriced securities providing an excellent, low risk, buy point; and, the difference between perception and reality is where our opportunities lie!
Raymond James’ analysts work diligently, attempting to determine the difference between “perception and reality” in many of the under-researched/under-owned companies. As a result, their insights and knowledge brings added value to the investment equation. This has produced some very interesting year-end opportunities from our research universe of companies, which we urge you to discuss with our financial advisors and our institutional sales folks. Three of the names that have our attention, with positive ratings from our fundamental analysts, include: Axon Enterprise (AAXN/$43.47/Outperform); Flexion Therapeutics (FLXN/$16.31/Strong Buy); and Viking Therapeutics (VKTX/$11.29/Strong Buy).
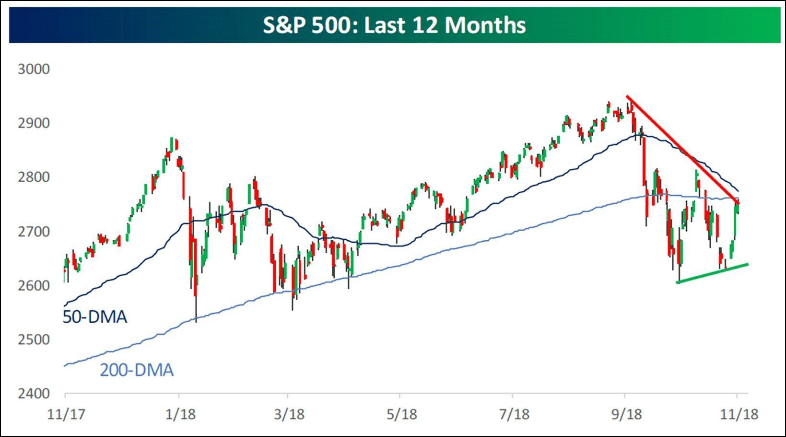
As for the stock market, so far it is pretty much as we surmised following our October 2 traders’ sell signal. The bottom was made on October 29 at 2603, which Andrew Adams identified, with the subsequent rally stalling in the prescribed 2800 – 2820 zone as we thought. We wrote from there the S&P 500 (SPX/2760.17) should have a pullback and make a secondary low above the October 29 intraday low. We said if that pattern plays it would trace-out a double-bottom in the charts, which happened, and the S&P 500 has now run up to the downtrend line (chart 1). As we wrote in Friday’s Morning Tack:
“The recent panic buying has used-up the stock market’s very short-term internal energy and probably means the SPX will park itself around the 2730 – 2740 level for a few sessions before the upside skein resumes. This view is supported by yesterday’s failure to follow through on Wednesday’s Win.”
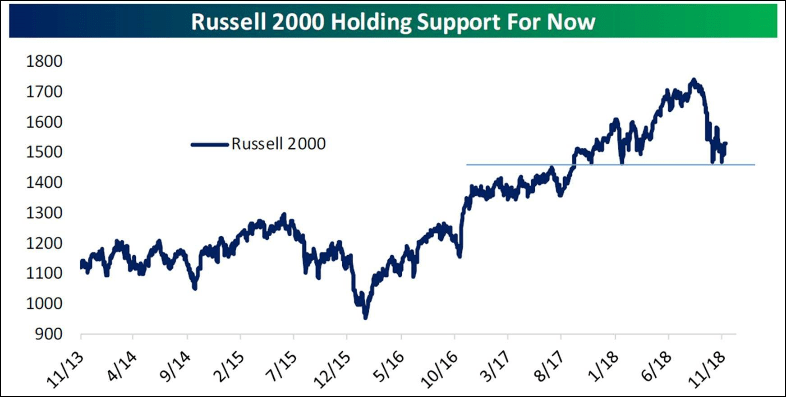
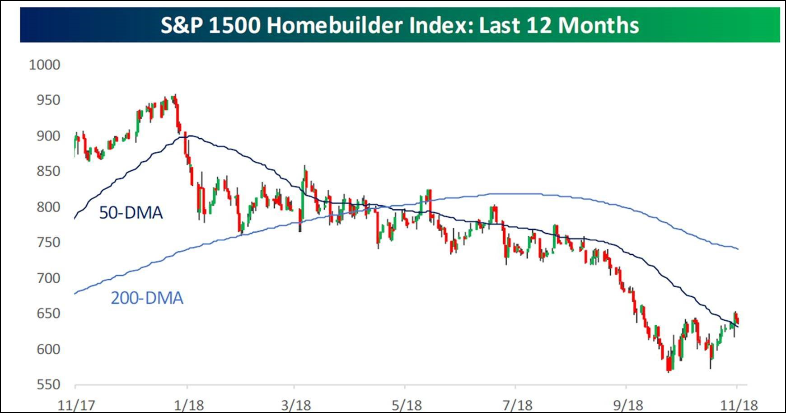
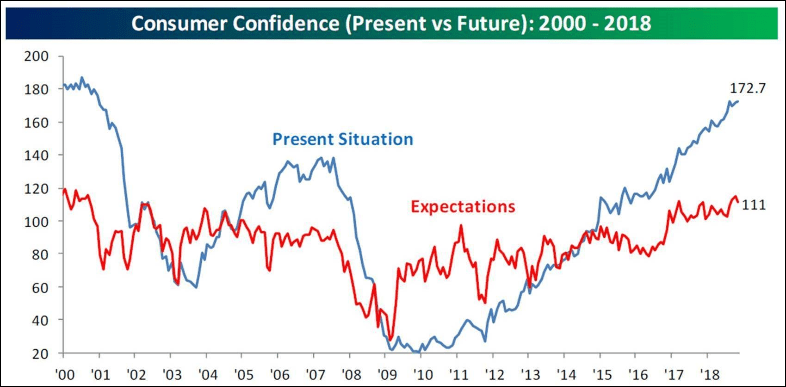
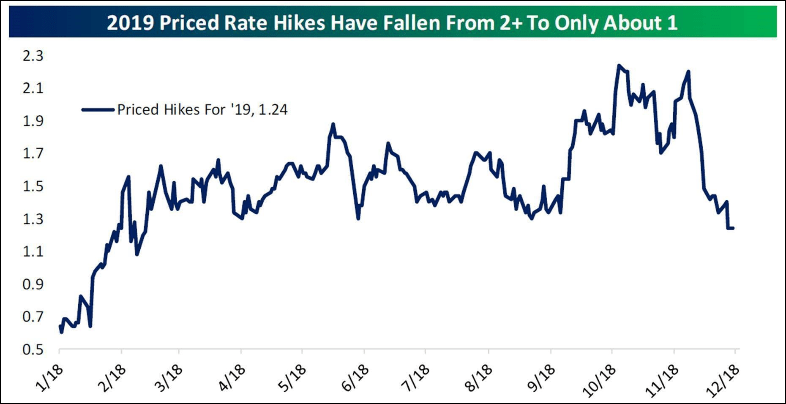
Meanwhile, the Russell 2000 (RUT/1533.27) has pulled back to support (chart 2), and don’t look now, but the Homebuilder Index has broken out to a new reaction high and is above its 50-day moving average (chart 3). Also confirming the upside is the Advance-Decline Line (chart 4). As for the talk that our country is headed for a recession, we point to the Present Situation Index that is suggesting no recession is in sight (chart 5) and would note recessions tend to start 26 months after the Leading Economic Index peaks; and, the LEI is nowhere near peaking. Further, U.S. Industrial Production is ramping at a record pace (chart 6). Because of the recent slowdown in some of the economic reports the odds of 2+ rate hikes in 2019 have fallen to 1 (chart 7). Given that, it’s not surprising the Homebuilder Index has broken out (chart 3). We continue to like our “long the index of your choice” recommendation near the double-bottom in the charts, and while our “go long crude oil/energy” has worked only marginally, we still favor the energy space. Also, as a follow up, our recommendation of going long the Transports in late October seems to be working as the D-J Transportation Average (TRAN/5389.67) notched new reaction highs last week.
The call for this week: We are in NYC this week doing gigs for our financial advisors, seeing institutional accounts, and doing a bunch of media appearances. As we enter the month of December it is worth mentioning that according to our pals at the astute Bespoke Investment Group:
“Monday kicks off a new month and the last month of 2018 at that. With this week’s rally, November was able to finish off on a positive note, and the hope is that it marked the start of the Santa Claus Rally. . . . Over the last 100 years, the Dow has averaged a gain of 1.55% in December with gains 74% of the time. In this time period, there has been no month that has been stronger or more consistent to the upside. Over the last 50 years, December is tied with April and November for being the most consistent and only trails April in terms of average gain.”
As we have surmised for months, Mexico and Canada “blinked,” and now China has “blinked” on the trade tiff, which is why we have been “buyers” at the October 29, 2018 lows, and again at the subsequent secondary lows around ~2631, which indeed was above the October 29 low of 2603 that we suggested would happen; QED! What continues to be amazing to us, is that most seers that never saw the decline coming, and were WAY too cautious at the subsequent “lows,” which they didn’t buy, are now attempting to tell you what to do now . . . amazing! This morning, well you can see what the pre-opening futures are doing.
Chart 6
Source: Bespoke Investment Group
Additional information is available on request. This document may not be reprinted without permission.
Raymond James & Associates may make a market in stocks mentioned in this report and may have managed/co-managed a public/follow-on offering of these shares or otherwise provided investment banking services to companies mentioned in this report in the past three years.
RJ&A or its officers, employees, or affiliates may 1) currently own shares, options, rights or warrants and/or 2) execute transactions in the securities mentioned in this report that may or may not be consistent with this report’s conclusions.
The opinions offered by Mr. Saut should be considered a part of your overall decision-making process. For more information about this report – to discuss how this outlook may affect your personal situation and/or to learn how this insight may be incorporated into your investment strategy – please contact your Raymond James Financial Advisor.
All expressions of opinion reflect the judgment of the Equity Research Department of Raymond James & Associates at this time and are subject to change. Information has been obtained from sources considered reliable, but we do not guarantee that the material presented is accurate or that it provides a complete description of the securities, markets or developments mentioned. Other Raymond James departments may have information that is not available to the Equity Research Department about companies mentioned. We may, from time to time, have a position in the securities mentioned and may execute transactions that may not be consistent with this presentation’s conclusions. We may perform investment banking or other services for, or solicit investment banking business from, any company mentioned. Investments mentioned are subject to availability and market conditions. All yields represent past performance and may not be indicative of future results. Raymond James & Associates, Raymond James Financial Services and Raymond James Ltd. are wholly-owned subsidiaries of Raymond James Financial.
International securities involve additional risks such as currency fluctuations, differing financial accounting standards, and possible political and economic instability. These risks are greater in emerging markets.
Investors should consider the investment objectives, risks, and charges and expenses of mutual funds carefully before investing. The prospectus contains this and other information about mutual funds. The prospectus is available from your financial advisor and should be read carefully before investing.
Black MondayOn 19 October 1987, the stock markets experienced a dramatic plunge that prompted many firms to shut down their trading desks and turn off their phones to minimize internal losses. Raymond James refused to do the same. Our desks stayed open to help meet clients’ needs, resulting in our first and only unprofitable quarter since the firm went public in 1983. |
 |
Who was Raymond James?The Raymond in our name is actually from Edward Raymond, owner of a 15-employee mutual fund sales group, Raymond and Associates, along Florida’s west coast. He sold his company to Bob James on 15 July 1964, on condition that the surviving firm be called Raymond, James & Associates. Three days after the sale, Ed Raymond was involved in a near-fatal automobile accident and never joined the firm. Nonetheless, even after Raymond had passed away, Bob James insisted that his name remain on the door – ahead of James’ own. That was a promise he made to Ed Raymond three days before the accident, and Bob James was a man who kept his promises. |

|
Bear Market of 1974The severe bear market of 1974 threatened the existence of Raymond James, which was bleeding capital by the day. Tom James, his father and other leaders took extreme measures to keep the firm afloat, slashing costs, foregoing paychecks and even attempting to sell the firm for just enough capital to protect client assets and retain as many associates as possible. The story could have ended very differently if not for a sharp upturn and continued rebound in the stock markets late in the year. |

|
Taking Raymond James PublicWhen consideration was being given to taking Raymond James public, Tom James penned a letter to shareholders (largely employees at the time). ” … the public offering should be considered as a statement of our independence. While this is a psychological rather than an economic rationale, it is nonetheless very important. We have asserted for some time that we are not interested in becoming a small part of a very large corporation. That assertion results mainly from the inclinations of management rather than the economic benefits associated with either alternative. The public stock offering affords us the opportunity to enjoy a little bit of the best of both worlds. While shareholders will be given liquidity at fair market value, we will still have the ability to control our own destiny.” After 40+ years of Tom’s leadership, upon becoming CEO, Paul Reilly was often questioned about whether the company might ultimately surrender its cherished independence and be acquired by some larger entity. His response: “Not while I’m around.” It’s a theme that continues today. |
 |